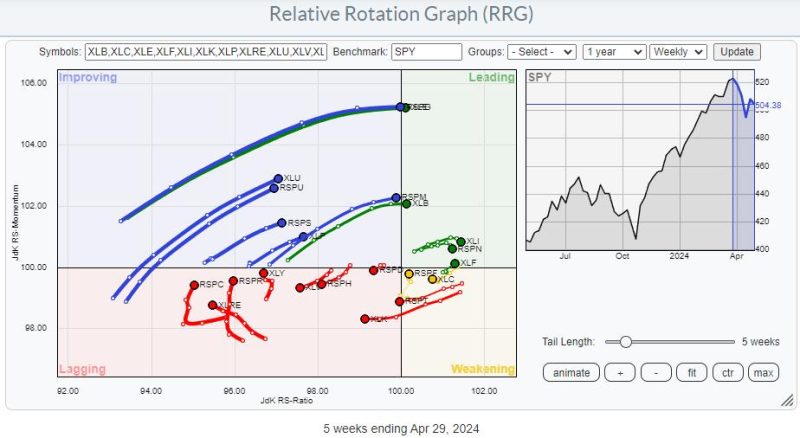
Relative Rotation Graph (RRG) analysis is a valuable tool for traders and investors seeking to identify potential opportunities in the financial markets. RRG offers a visual representation of the relative strength and momentum of different assets, allowing for a deeper understanding of market trends and potential trading opportunities.
One of the key aspects of RRG analysis is the concept of diverging tails, which can unveil important insights for traders. When two assets have tails that are moving in opposite directions on the RRG chart, it indicates a significant divergence in their relative strength and momentum. This divergence can be a strong indicator of potential trading opportunities, as it suggests that one asset is outperforming the other and may continue to do so in the near future.
By paying close attention to diverging tails on the RRG chart, traders can identify pairs of assets that are moving in different directions and potentially exploit this information to make profitable trades. For example, if one asset has a tail that is moving strongly to the northeast while another asset has a tail that is moving sharply to the southwest, it suggests that there is a significant divergence in their performance.
Traders can use this information to make relative strength trades, where they go long on the stronger asset and short the weaker asset in the pair. By taking advantage of this divergence in performance, traders can capitalize on the relative outperformance of one asset over the other, potentially generating profits in the process.
Furthermore, diverging tails on the RRG chart can also be used to identify potential trend reversals or changes in market dynamics. When an asset’s tail abruptly changes direction and begins to diverge from other assets, it can signal a shift in market sentiment and provide early warning signs of a potential trend reversal.
In conclusion, RRG analysis offers a valuable tool for traders and investors to identify trading opportunities based on the relative strength and momentum of different assets. By paying close attention to diverging tails on the RRG chart, traders can uncover potential opportunities for profitable trades and gain valuable insights into market trends and dynamics.
