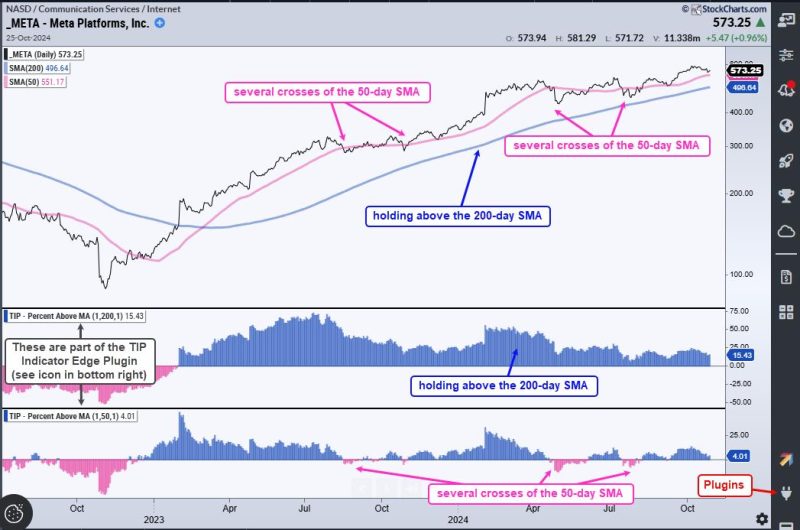
In the realm of trading and investing, the quest for improving one’s edge is a constant pursuit for maximizing profits and optimizing strategies. Two key indicators that can significantly enhance an individual’s edge in the market are the Relative Strength Index (RSI) and the Moving Average Convergence Divergence (MACD). These indicators, when used effectively, can provide valuable insights into market trends and potential entry and exit points for trades.
The Relative Strength Index (RSI) is a momentum oscillator that measures the speed and change of price movements. It is often used to identify overbought or oversold conditions in a particular security. The RSI ranges from 0 to 100, with readings above 70 indicating an overbought condition and readings below 30 indicating an oversold condition. By paying attention to these levels, traders can make more informed decisions on when to enter or exit trades.
Incorporating the RSI into a trading strategy can help traders avoid entering positions at the peak of a trend or selling at the bottom. By waiting for the RSI to signal potential reversals, traders can increase the probability of successful trades and reduce the risk of losses. Additionally, divergence between the RSI and price movement can also be a powerful signal of a potential trend reversal, providing traders with an early warning sign to adjust their positions accordingly.
Moving Average Convergence Divergence (MACD) is another popular momentum indicator that shows the relationship between two moving averages of a security’s price. The MACD is calculated by subtracting the 26-day exponential moving average (EMA) from the 12-day EMA, with a signal line calculated as a 9-day EMA of the MACD. When the MACD line crosses above the signal line, it is considered a bullish signal, indicating that the price is likely to rise. Conversely, when the MACD line crosses below the signal line, it is a bearish signal, suggesting that the price may fall.
Traders can use the MACD to identify trends and potential trend reversals in the market. By paying attention to the crossovers and divergences between the MACD and the signal line, traders can make more accurate predictions about future price movements and adjust their positions accordingly. Combining the MACD with other technical analysis tools can further enhance its effectiveness in improving an individual’s edge in the market.
In conclusion, the Relative Strength Index (RSI) and Moving Average Convergence Divergence (MACD) are two powerful indicators that can greatly improve an individual’s edge in trading and investing. By incorporating these indicators into a well-thought-out trading strategy, traders can make more informed decisions, identify potential trends, and increase the likelihood of successful trades. Understanding how to effectively use these indicators can provide traders with a competitive advantage in the market and ultimately contribute to long-term profitability.
