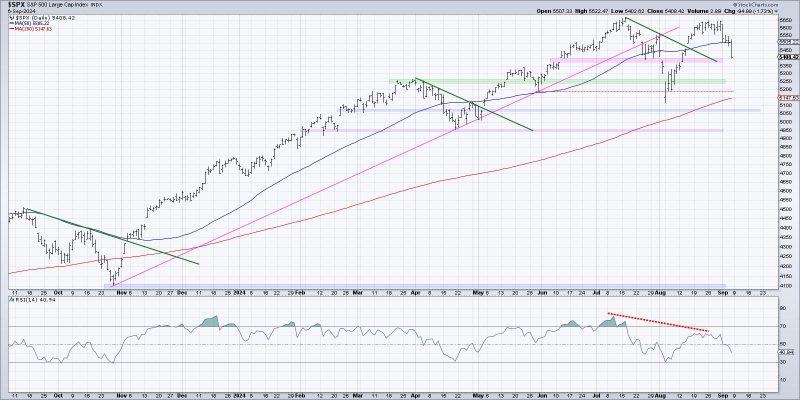
In the world of investing, the ability to identify potential market tops and bottoms is crucial for traders and investors alike. While no one can predict the markets with certainty, various indicators and tools can provide valuable insights into the current state of the market. In this regard, three key charts stand out as important tools that may signal a potential market top.
Chart 1: The Relative Strength Index (RSI)
The Relative Strength Index (RSI) is a momentum oscillator that measures the speed and change of price movements. It oscillates between 0 and 100 and is commonly used to identify overbought or oversold conditions in the market. When the RSI reaches extreme levels above 70, it may indicate that the market is overbought and due for a correction. Conversely, RSI readings below 30 suggest that the market may be oversold. Traders often use the RSI in conjunction with other technical indicators to confirm potential market reversals.
Chart 2: Moving Averages
Moving averages are trend-following indicators that smooth out price data to identify the underlying trend. The most commonly used moving averages are the 50-day and 200-day moving averages. When the shorter-term moving average crosses below the longer-term moving average, it is known as a death cross and may signal a potential market top. Conversely, a golden cross occurs when the shorter-term moving average crosses above the longer-term moving average, indicating a bullish trend. Traders often monitor moving averages to gauge the strength and direction of the market trend.
Chart 3: Volume Analysis
Volume analysis is another important tool for identifying potential market tops. Volume measures the number of shares traded in a security over a given period and can provide valuable insights into market participation. In general, increasing volume during an uptrend suggests strong buying pressure, indicating a healthy market. However, declining volume coupled with rising prices may signal weakening momentum and a potential market top. Traders often pay close attention to volume patterns to confirm market trends and potential reversals.
In conclusion, while no single chart or indicator can predict market movements with absolute certainty, the three charts mentioned above can provide valuable insights into the current state of the market. By monitoring indicators such as the RSI, moving averages, and volume analysis, traders and investors can better assess market conditions and make informed decisions. Remember, it’s important to use these tools in conjunction with other forms of analysis and risk management strategies to navigate the complexities of the financial markets successfully.
