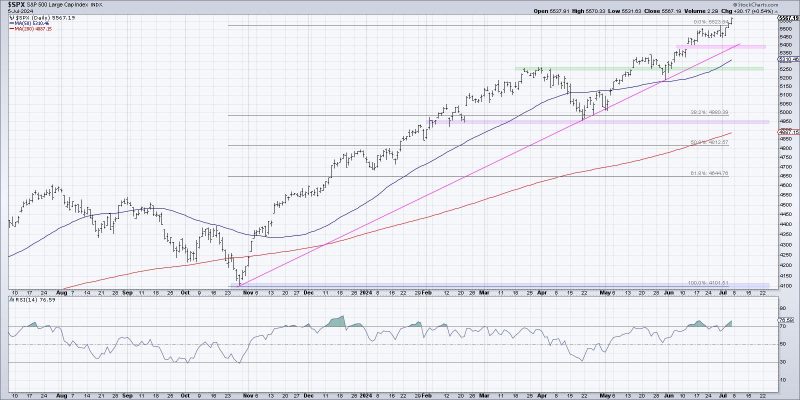
In the ever-changing landscape of the stock market, navigating through market tops can be challenging for investors. Recognizing when a market is at its peak can be crucial in making informed investment decisions. A chart tailored to assessing a summer market top can provide a helpful framework for investors to strategize their actions.
The first component of the chart focuses on market sentiment. It is essential to gauge overall market sentiment as it can indicate whether investors are overly optimistic or cautious. High levels of positivity may suggest that the market is reaching a peak, as euphoria can lead to overvaluation of stocks. Conversely, extreme fear or pessimism could signal a buying opportunity as stocks may be undervalued.
The next aspect to consider is the technical indicators on the chart. Technical analysis involves studying past market data, primarily price and volume, to forecast future price movements. Common technical indicators include moving averages, relative strength index (RSI), and MACD (Moving Average Convergence Divergence). Observing these indicators can help investors identify potential trend reversals or confirm the current market trend.
Another critical component of the chart is historical price patterns. Certain price patterns, such as head and shoulders or double tops, can indicate a potential market top. These patterns reflect shifts in supply and demand dynamics and can be used to predict future price movements. By analyzing historical price patterns, investors can anticipate potential reversals in the market.
Furthermore, monitoring market breadth can provide valuable insights into the overall health of the market. Market breadth refers to the number of stocks participating in a market advance or decline. A narrowing market breadth, where only a few stocks are driving the market higher, could be a warning sign of a market top. Conversely, broad participation across various sectors and stocks is a positive indicator of a healthy market.
Additionally, keeping an eye on fundamental factors is essential when evaluating a market top. Fundamental analysis involves assessing a company’s financial health, industry trends, and economic indicators to determine its intrinsic value. Overvalued stocks with high price-to-earnings ratios or excessive debt levels may be vulnerable to a market correction. By analyzing fundamental data, investors can make more informed decisions based on the underlying value of a stock or market.
In conclusion, navigating a summer market top requires a comprehensive approach that considers various factors. By utilizing a chart that incorporates market sentiment, technical indicators, historical price patterns, market breadth, and fundamental analysis, investors can better assess the market environment and make informed decisions. Staying vigilant and adapting to changing market conditions are essential to successfully navigating through market tops and preserving investment capital.
