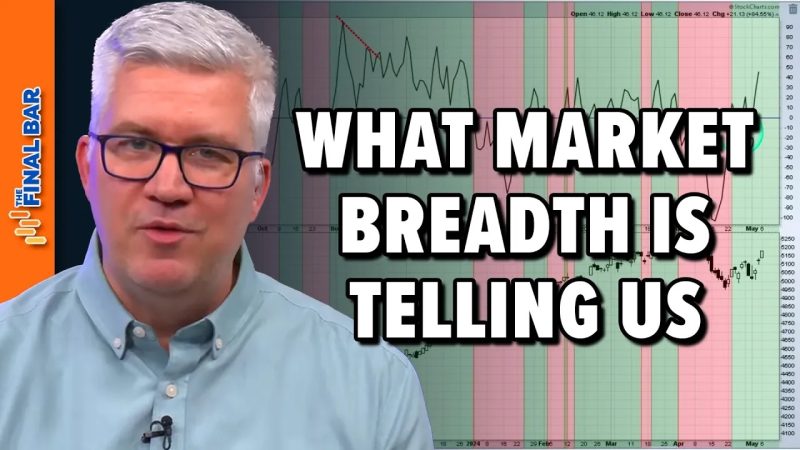
The Market Breadth Indicator You Should Be Following
Understanding the nuances and intricacies of the stock market can be an overwhelming task for many investors. With various indicators and metrics available, it can often be challenging to determine which ones are the most reliable and valuable for making informed investment decisions. One such indicator that holds significant importance in the world of stock market analysis is market breadth.
Market breadth refers to the overall health and direction of the market by measuring the number of individual stocks participating in a market move. This indicator can provide valuable insights into the underlying strength or weakness of the market, helping investors gauge the breadth of investor participation.
The most common way to track market breadth is through the use of technical indicators such as the Advance-Decline Line (A/D Line). The A/D Line tracks the difference between the number of advancing and declining stocks on a given trading day. A rising A/D Line suggests broad-based market strength, indicating that a large number of stocks are participating in an uptrend. Conversely, a declining A/D Line signals potential weakness in the market, as fewer stocks are advancing compared to declining.
Another popular market breadth indicator is the McClellan Oscillator, which measures the difference between two Exponential Moving Averages (EMAs) of advancing and declining issues. The McClellan Oscillator is a momentum oscillator that helps identify overbought or oversold conditions in the market. Values above zero indicate positive market breadth, while values below zero suggest negative breadth.
Investors can also use market breadth indicators to identify potential market turning points. For example, when the market is making new highs but the A/D Line fails to confirm the upward momentum, it may signal a lack of broad-based market participation, potentially foreshadowing a market reversal.
In addition to the traditional market breadth indicators, investors can also utilize sector breadth indicators to gain deeper insights into market movements. By tracking the performance of individual sectors within the market, investors can identify sector rotation patterns and pinpoint sectors that are leading or lagging in a market rally.
Ultimately, incorporating market breadth indicators into your investment analysis can provide a holistic view of market dynamics and help you make more informed investment decisions. By monitoring the breadth of market participation, investors can better assess the overall health of the market and stay ahead of potential trend reversals.
In conclusion, market breadth indicators play a crucial role in evaluating the strength and direction of the market. By tracking the participation of individual stocks and sectors in market moves, investors can gain valuable insights that can enhance their investment decision-making process. Whether using traditional indicators like the A/D Line or more advanced tools like the McClellan Oscillator, understanding market breadth can empower investors to navigate the complexities of the stock market with confidence.
