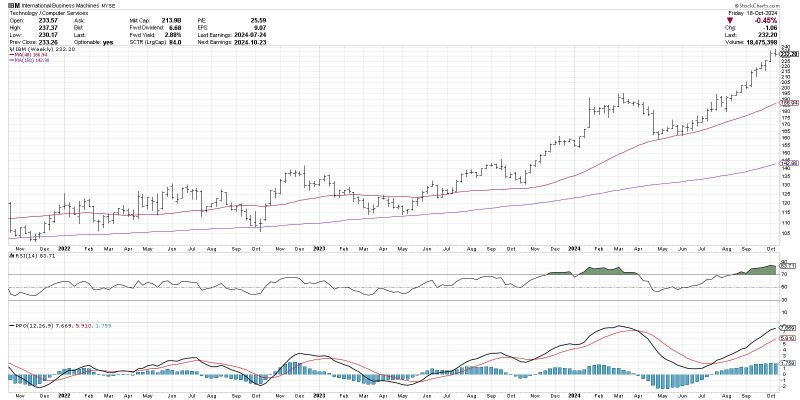
The MACD Histogram: A Key Indicator for Anticipating Trend Changes
Understanding market trends and anticipating potential shifts is a critical aspect of successful trading. Traders employ various indicators and tools to help them make informed decisions, with one popular tool being the Moving Average Convergence Divergence (MACD) histogram. This histogram, derived from the MACD indicator, is a powerful tool that can provide valuable insights into potential trend changes. By analyzing the MACD histogram, traders can gain a better understanding of market momentum and identify potential entry and exit points.
The MACD histogram is a technical indicator that represents the difference between the MACD line and the signal line. The MACD line is calculated by subtracting the 26-period Exponential Moving Average (EMA) from the 12-period EMA, while the signal line is a 9-period EMA of the MACD line. The histogram, then, is simply the difference between the MACD line and the signal line, plotted as vertical bars above or below a central zero line.
One of the key ways in which traders use the MACD histogram is to identify potential trend changes. When the histogram crosses above the zero line, it indicates that positive momentum is increasing, suggesting a potential uptrend. Conversely, when the histogram crosses below the zero line, it signals that negative momentum is gaining strength, indicating a potential downtrend. By monitoring these crosses, traders can anticipate trend changes and adjust their trading strategies accordingly.
Moreover, the shape and size of the histogram bars can also provide valuable information to traders. Large and increasing histogram bars indicate strong momentum in the prevailing trend, while shrinking bars suggest weakening momentum. Divergences between the price chart and the MACD histogram can also signal potential trend reversals. For example, if the price is making higher highs while the histogram is making lower highs, it may indicate weakening bullish momentum and a potential trend reversal.
Another aspect of the MACD histogram that traders often pay attention to is the slope of the bars. A rising histogram suggests increasing momentum in the prevailing trend, while a falling histogram indicates waning momentum. By analyzing the slope of the bars in conjunction with other technical indicators, traders can gain valuable insights into the strength of the trend and potential opportunities for entry and exit.
In conclusion, the MACD histogram is a valuable tool for traders looking to anticipate trend changes and make informed trading decisions. By analyzing the crosses, size, shape, divergences, and slope of the histogram bars, traders can gain valuable insights into market momentum and potential trend reversals. Incorporating the MACD histogram into a comprehensive trading strategy can help traders enhance their decision-making process and improve their overall trading performance.
