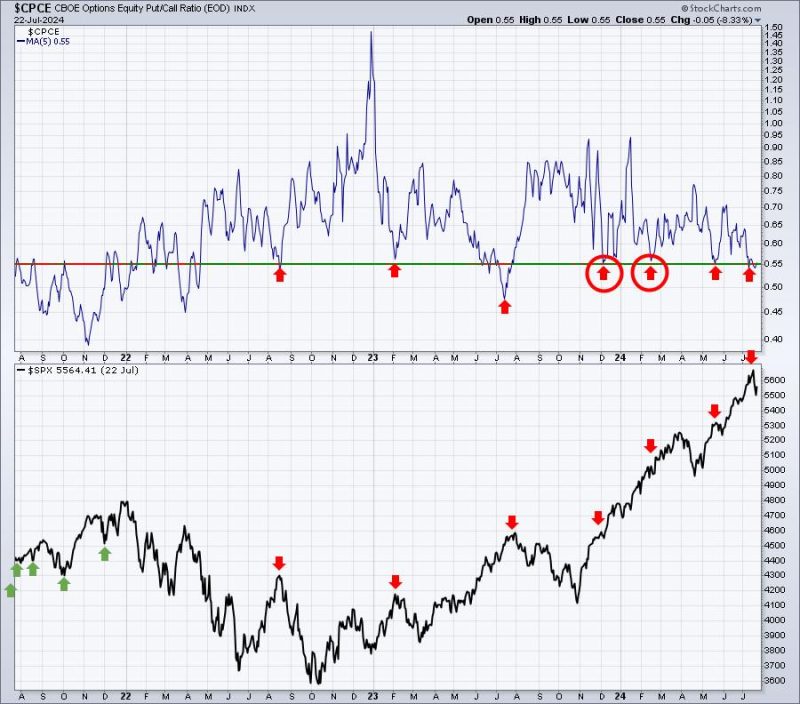
In the financial world, market bottoms are crucial turning points that traders eagerly anticipate as they often signal potential upward trends. Identifying the bottom of a market can be challenging, but it is a skill that seasoned traders and investors have honed over time. By analyzing trends, patterns, and key indicators, they can make informed decisions on whether a market has likely hit its bottom. In this article, we will delve into three essential charts that traders often watch to determine if a market has bottomed out.
**1. Price Action Chart**
Price action charts display the movement of an asset’s price over a specific period. Traders closely monitor price action as it provides valuable insights into market sentiment and potential turning points. A common pattern that traders look for when identifying a market bottom is a double bottom formation. This pattern occurs when the price drops to a certain level, bounces back up, then retreats again to near the previous low before reversing its course.
**2. Volume Chart**
Volume is a crucial indicator that helps traders gauge the strength of a market trend. When a market bottoms out, a significant increase in trading volume often accompanies the reversal. This surge in volume indicates heightened interest and participation from traders, signaling a potential shift in market sentiment. By monitoring volume charts, traders can confirm the validity of a market bottom and identify potential opportunities for profit.
**3. Moving Average Chart**
Moving averages are essential tools for traders to smooth out price data and identify trends over time. When a market bottoms out, traders often observe a crossover of shorter-term moving averages above longer-term moving averages. This crossover, known as a golden cross, is considered a bullish signal that indicates a potential trend reversal. By analyzing moving average charts, traders can identify key points where the market may have bottomed and anticipate future price movements.
In conclusion, identifying market bottoms is a crucial skill that traders develop through experience and analysis of various charts and indicators. By closely monitoring price action, volume, and moving averages, traders can make informed decisions on whether a market has likely hit its bottom and is poised for an upward trend. While no method guarantees success in trading, understanding these three charts can provide valuable insights and increase the probability of making profitable trades in volatile markets.
