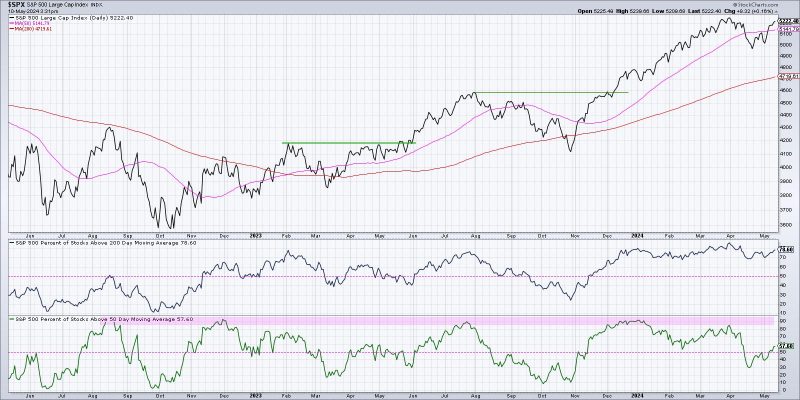
Breadth indicators are valuable tools for investors and traders seeking to confirm a bullish market trend. By analyzing the market from a broader perspective, these indicators provide crucial insights into the strength and sustainability of the current trend. In this article, we will discuss three essential breadth indicators that can help confirm a bullish market trend.
1. Advance-Decline Line (AD Line):
The Advance-Decline Line is a popular breadth indicator that measures the number of advancing stocks minus the number of declining stocks on a given trading day. It reflects the overall momentum of the market by showing whether more stocks are moving higher or lower. A rising AD Line indicates that more stocks are advancing, signaling a healthy market breadth and confirming a bullish trend. Conversely, a declining AD Line suggests a lack of broad participation in the market rally, raising concerns about the sustainability of the uptrend.
2. New Highs-New Lows Index:
The New Highs-New Lows Index compares the number of stocks reaching new 52-week highs to those reaching new 52-week lows. This breadth indicator helps investors gauge the breadth of market participation in the rally. When the number of new highs surpasses new lows, it signifies a broad-based bullish trend across various sectors and industries. On the other hand, a divergence between new highs and new lows may indicate weakening market breadth and the potential for a trend reversal.
3. McClellan Oscillator:
The McClellan Oscillator is a market breadth indicator that measures the difference between the 19-day EMA (Exponential Moving Average) and the 39-day EMA of advancing and declining issues on the NYSE. This oscillator oscillates above and below a zero line, with positive values indicating bullish market breadth and negative values suggesting bearish breadth. A rising McClellan Oscillator indicates increasing market momentum and broad participation, supporting the bullish market trend. Conversely, a declining oscillator may signal waning market breadth and potential downside risks.
By analyzing these breadth indicators in conjunction with other technical and fundamental factors, investors can gain a comprehensive view of the market environment and make informed decisions. It is essential to remember that no single indicator can predict market movements with absolute certainty. Still, by leveraging multiple breadth indicators, investors can strengthen their market analysis and enhance their trading strategies in a bullish market trend.
