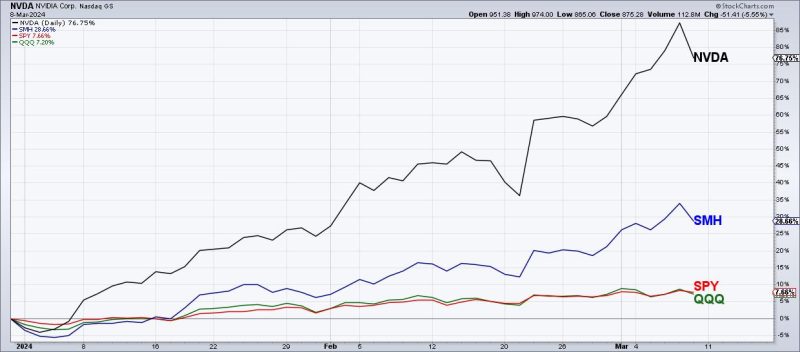
The bearish engulfing pattern has long been a reliable indicator of potential trend reversals in the world of technical analysis. When this pattern emerges on stock charts, it typically signifies a shift from bullish sentiment to bearish sentiment among traders and investors. In the case of NVDA, the bearish engulfing pattern has recently appeared, suggesting that the stock may have reached a top and could be poised for a downward correction.
NVDA, the popular semiconductor company known for its graphics processing units (GPUs) and chipsets, has experienced significant growth in recent years, driven by the increasing demand for its products in various industries, including gaming, artificial intelligence, and data centers. However, the presence of the bearish engulfing pattern on the stock chart raises concerns about a potential reversal in NVDA’s upward trajectory.
The bearish engulfing pattern is formed when a larger bearish candlestick completely engulfs the previous smaller bullish candlestick. This pattern is often seen as a signal that the balance of power between buyers and sellers has shifted, with sellers gaining control and pushing the price lower. In the case of NVDA, the appearance of the bearish engulfing pattern suggests that the stock’s recent uptrend may have run its course and that a downtrend could be on the horizon.
Traders and investors who rely on technical analysis often use the bearish engulfing pattern as a way to time their trades and make informed decisions about when to enter or exit positions. In the case of NVDA, the emergence of this pattern could prompt some traders to consider selling their positions or taking profits if they have been holding the stock for a prolonged period.
While the bearish engulfing pattern is a powerful indicator of potential trend reversals, it is essential to note that no single pattern or signal is foolproof. Market conditions can change rapidly, and other factors, such as fundamental news or macroeconomic events, can also influence stock prices. Therefore, it is crucial for traders and investors to use the bearish engulfing pattern in conjunction with other technical indicators and risk management strategies to make well-informed trading decisions.
In conclusion, the appearance of the bearish engulfing pattern on NVDA’s stock chart serves as a warning sign for traders and investors that the stock may be reaching a top and could be due for a downward correction. While this pattern can be a valuable tool for timing trades, it is essential to consider other factors and use proper risk management techniques when making investment decisions. By staying informed and vigilant, traders can navigate the markets with greater confidence and make better-informed decisions about their trading activities.
